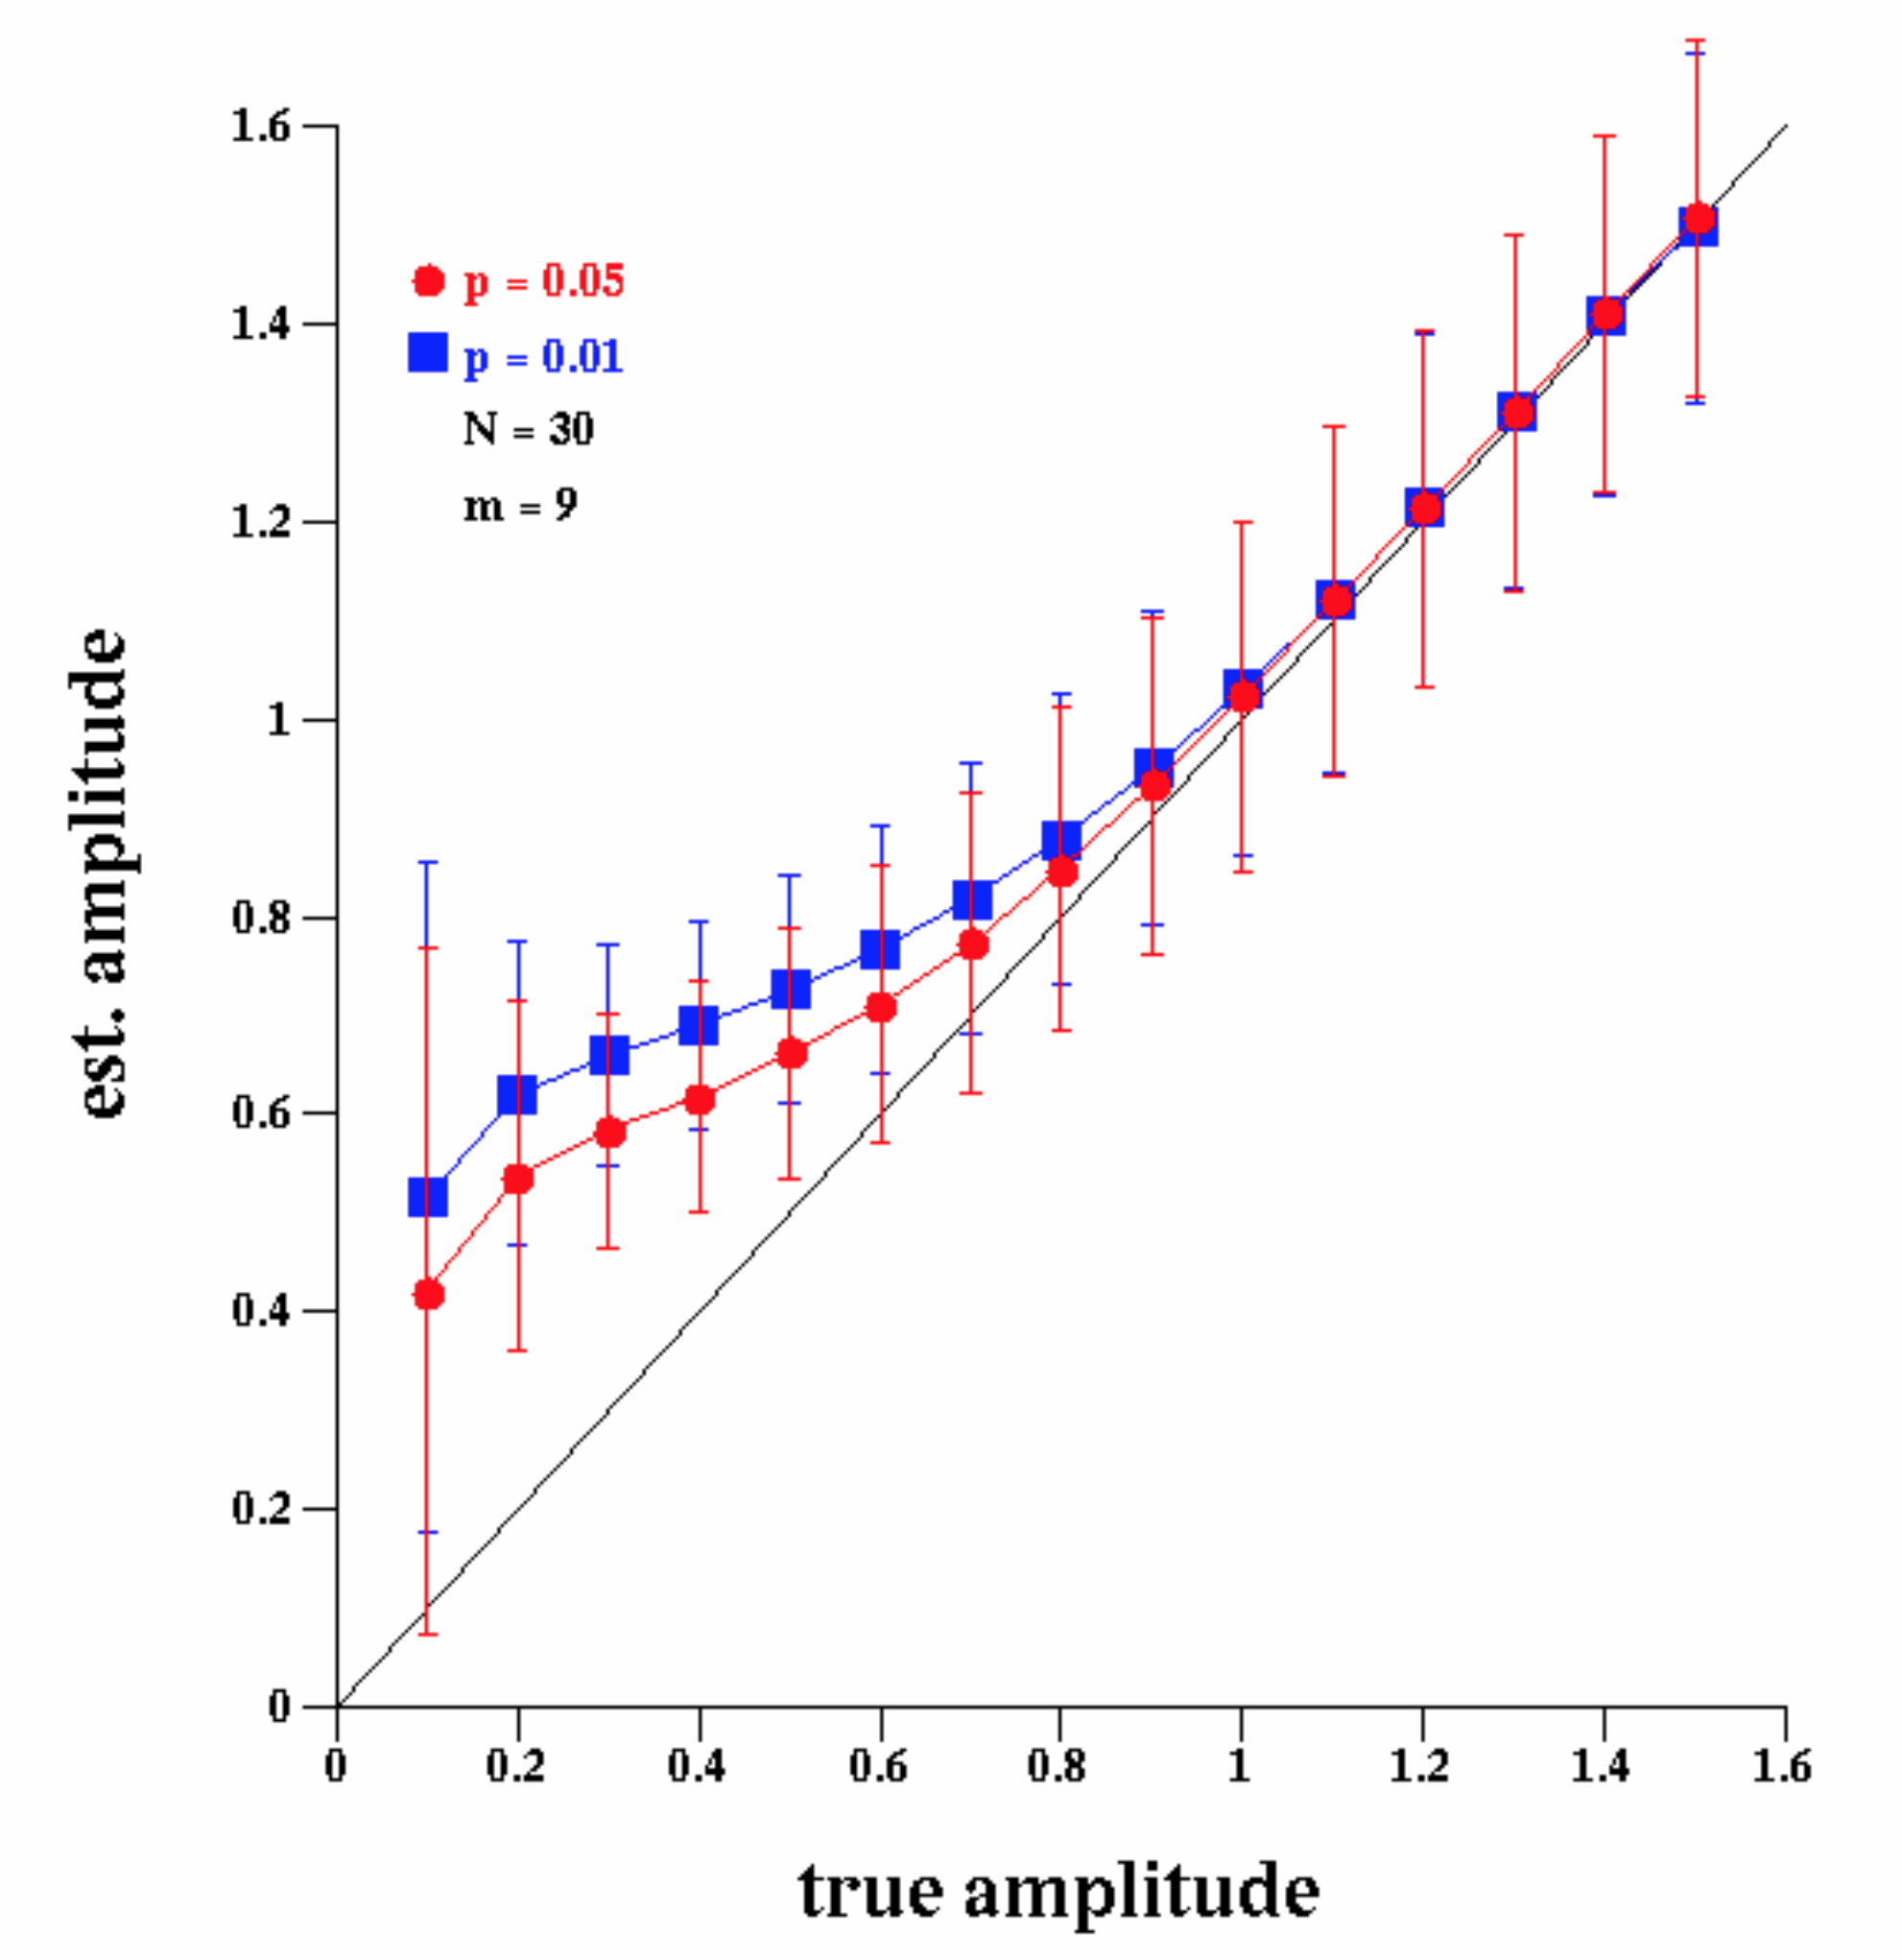
... for amplitudes below the noise standard deviation link to previous slide link to next slide
     
dividing line

Figure showing a plot of the estimated saccade amplitude versus the true saccade amplitude, for two values of the false alarm rate